Observability is the engineering practice that determines whether a team can understand their system's internal state from its external outputs — without requiring a priori knowledge of which specific failure to look for. In federal cloud environments, observability is both a technical discipline and a compliance requirement: NIST 800-53 requires comprehensive monitoring and audit capabilities that observability tooling directly supports.
But many federal cloud teams conflate monitoring with observability, ending up with dashboards full of metrics that don't actually answer operational questions, and audit logs that satisfy compliance checkers without enabling meaningful investigation. This article covers what effective observability looks like in FedRAMP-authorized GovCloud environments — the three pillars, specific tooling in AWS GovCloud, and the practices that separate functional observability from checkbox compliance.
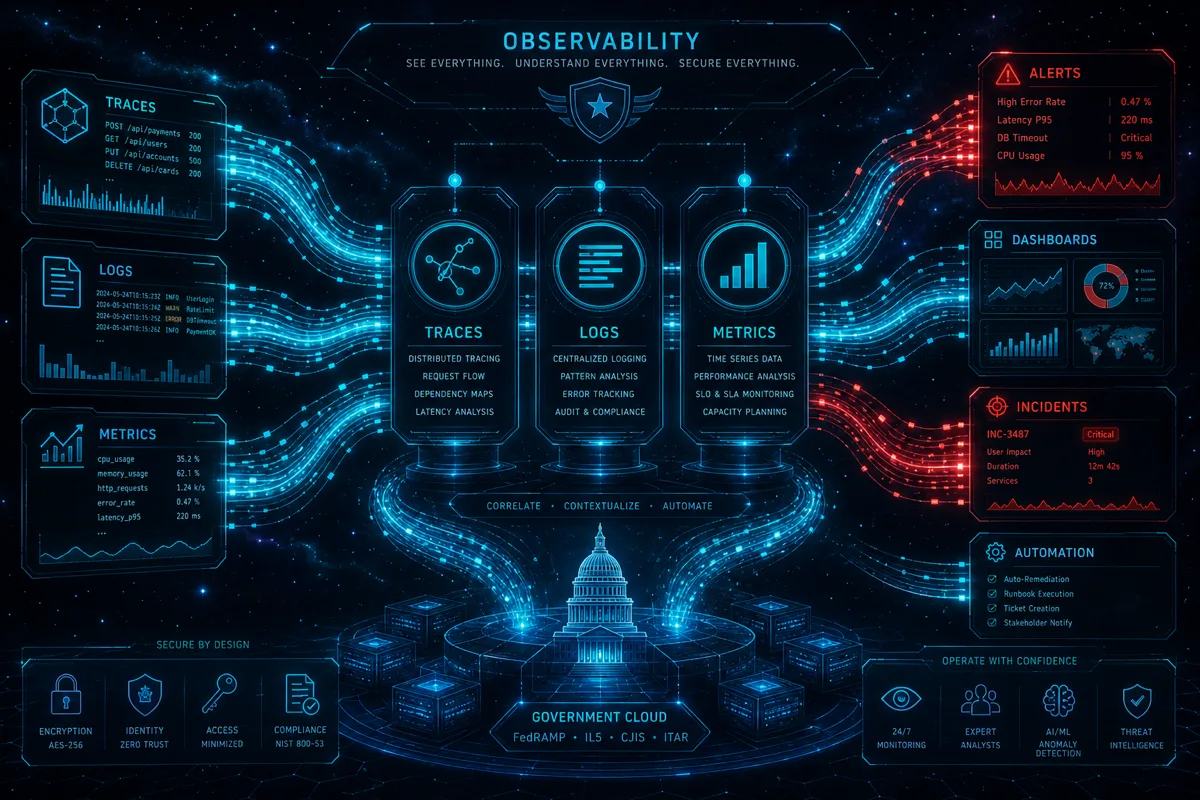
The Three Pillars of Observability in Federal Systems
Metrics: Numerical measurements of system behavior over time — CPU utilization, request latency distributions, error rates, queue depths, active connections. Metrics are aggregated (you lose individual context in aggregation) and efficient at identifying trends and triggering alerts. CloudWatch metrics in AWS GovCloud are the foundation of federal system monitoring.
Logs: Timestamped, structured records of individual events — a specific request, an error, a configuration change, a security event. Logs preserve individual context that metrics lose. CloudWatch Logs in GovCloud, combined with structured logging (JSON format with consistent field names), enables queryable log analysis using CloudWatch Logs Insights.
Traces: End-to-end records of a request's journey through distributed system components. As federal systems increasingly span multiple microservices, Lambda functions, API Gateways, and messaging services, traces are the mechanism for understanding which component caused a specific user-visible failure. AWS X-Ray in GovCloud provides distributed tracing for services including Lambda, ECS, API Gateway, SQS, SNS, and DynamoDB.
Structured Logging: The Foundation Everything Else Depends On
The most impactful observability practice for federal systems is often the least exciting: structured logging. Unstructured log messages ("Error processing case request") are nearly impossible to query at scale. Structured logs (JSON with consistent fields) enable filtering, aggregation, and correlation across millions of log events.
Every log event in a federal application should include:
- timestamp (ISO 8601, UTC)
- correlation_id (request ID carried across all components of a user request)
- service_name and environment (identifies which component and deployment tier)
- log_level (DEBUG, INFO, WARN, ERROR, CRITICAL)
- event_type (a categorized event name enabling filtering: "request_received", "auth_failed", "case_updated")
- user_id or service_account (for audit correlation — who or what performed the action)
- duration_ms (for performance analysis)
- outcome (success/failure) and error_code where applicable
With structured logging, CloudWatch Logs Insights queries can answer operational questions in seconds: "How many times did a specific case ID appear in error logs in the last 4 hours?" "What is the p95 processing latency for Form A submissions over the past 24 hours?"
Distributed Tracing in Federal GovCloud
Federal systems increasingly process a single logical operation across multiple services — an API request may trigger a Lambda function, which updates a DynamoDB record, publishes to SQS, which triggers another Lambda, which writes to S3. When this chain fails, tracing is the mechanism for pinpointing which component caused the failure.
AWS X-Ray is available in AWS GovCloud and supports: - Automatic instrumentation of Lambda functions (native X-Ray support) - SDK instrumentation for Python, Node.js, Java, Go, and other runtimes - Integration with API Gateway (front-door trace propagation) - SQS and SNS trace propagation (traces continue across async messaging hops) - Service map visualization (graphical view of component interactions and error rates)
Sampling strategy: X-Ray traces a percentage of requests (configurable sampling rate) to manage cost and performance impact. For federal systems, a 5% sampling rate is typical for high-volume operations; 100% sampling may be warranted for specific sensitive operations (authentication, financial transactions) to ensure complete trace capture for audit purposes.
Alerting Architecture for Federal Cloud Systems
The goal of alerting is actionable signals — alerts that trigger real investigation because they indicate actual system impact, not noise that trains operators to ignore alerts. Effective alerting in federal cloud systems:
Alert on symptoms, not causes: "p99 API latency exceeded 2 seconds for 5 minutes" is a symptom alert — it directly indicates user impact. "CPU utilization exceeded 70% for 10 minutes" is a cause alert — it may or may not be causing user impact. Symptom-based alerts have better signal-to-noise ratios.
Tiered severity: Map alerts to response tiers. Critical (immediate PagerDuty/incident response trigger): total service unavailability, authentication failures spiking, security control failure. High (within-business-hours investigation): latency degradation, error rate elevation, queue depth growth. Informational: normal operational changes that may require future attention.
CloudWatch Alarm configuration best practices: - Use percentile metrics (p99, p95) rather than averages for latency — averages hide tail latency problems - Set evaluation periods that account for bursty traffic patterns (government systems often have known traffic spikes) - Configure alarm suppression during known maintenance windows - Route critical alarms to SNS topics with email/SMS/PagerDuty integrations
NIST 800-53 alignment: Control SI-4 (System Monitoring) requires that organizations monitor information systems to detect attacks, unauthorized connections, and anomalous usage. Your alerting architecture is part of your SI-4 implementation evidence — document alert thresholds, escalation procedures, and response playbooks.
Compliance Monitoring vs. Operational Observability
Federal teams often maintain two parallel monitoring practices: compliance-driven logging (CloudTrail for API calls, VPC Flow Logs for network traffic, Config for resource state changes) and operational monitoring (CloudWatch metrics, application logs, traces). These should not be siloed:
Security Hub integration: AWS Security Hub in GovCloud aggregates findings from GuardDuty, Security Hub standards, and third-party integrations into a unified security posture view. Security findings that indicate operational impact (GuardDuty finding that correlates with an API error spike) are best investigated when security and operational telemetry are co-visible.
CloudTrail as audit substrate: CloudTrail is the definitive audit record of all API calls in your AWS account — who (IAM principal), did what (API call), on what resource, when, from where (source IP). For federal systems, CloudTrail with S3 log archive and CloudTrail Insights (anomaly detection) is the minimum compliance logging baseline.
Rutagon builds observable federal cloud systems — from structured logging standards and distributed tracing implementation to full CloudWatch dashboard and alerting architectures for FedRAMP and DoD authorization boundary compliance.
Explore Our Observability Engineering →
Related reading: - Event-Driven Architecture in Federal Cloud - Incident Management in Government Cloud - AWS Network Firewall for Government Cloud
Frequently Asked Questions
What is the difference between monitoring and observability in federal cloud?
Monitoring answers "Is the system healthy?" (based on predefined metrics and thresholds). Observability answers "Why is the system behaving this way?" (based on the ability to interrogate system state from its outputs). Monitoring is a subset of observability — an observable system can answer arbitrary questions about its state; a monitored system can only answer questions the team thought to ask in advance.
Does AWS X-Ray meet FedRAMP High requirements for distributed tracing?
AWS X-Ray is available in AWS GovCloud and is FedRAMP High authorized as part of the AWS GovCloud services. X-Ray trace data is stored in the same authorization boundary as your application and is subject to the same access controls. Trace data containing CUI must be handled with appropriate access controls and retention policies consistent with your ATO.
What structured logging fields are most important for federal audit compliance?
At minimum: timestamp (UTC), user/service identity (who performed the action), action type (what happened), resource identifier (what was acted upon), outcome (success/failure), and correlation/request ID (to link events across components). These fields directly satisfy NIST 800-53 AU controls for audit record content and enable investigators to reconstruct what happened during a security incident.
How should federal cloud teams handle log retention for compliance?
NIST 800-53 AU-11 requires audit record retention for time periods defined by organizational policy (typically 3 years for federal systems; longer for certain categories). CloudWatch Logs retention policies should be set to match your compliance requirement. For long-term retention, log delivery to S3 with lifecycle policies (transition to Glacier after 90 days, indefinite retention in Glacier) is the cost-effective standard approach.
How many alerts is too many for a federal cloud system?
If your team is receiving more alerts than can be meaningfully investigated, you have too many alerts — regardless of the absolute count. Effective federal cloud monitoring teams aim for fewer than 5 actionable alerts per on-call engineer per shift. Audit your alert firing frequency monthly and suppress or tune any alert that fires more than once per week without resulting in a real operational response.