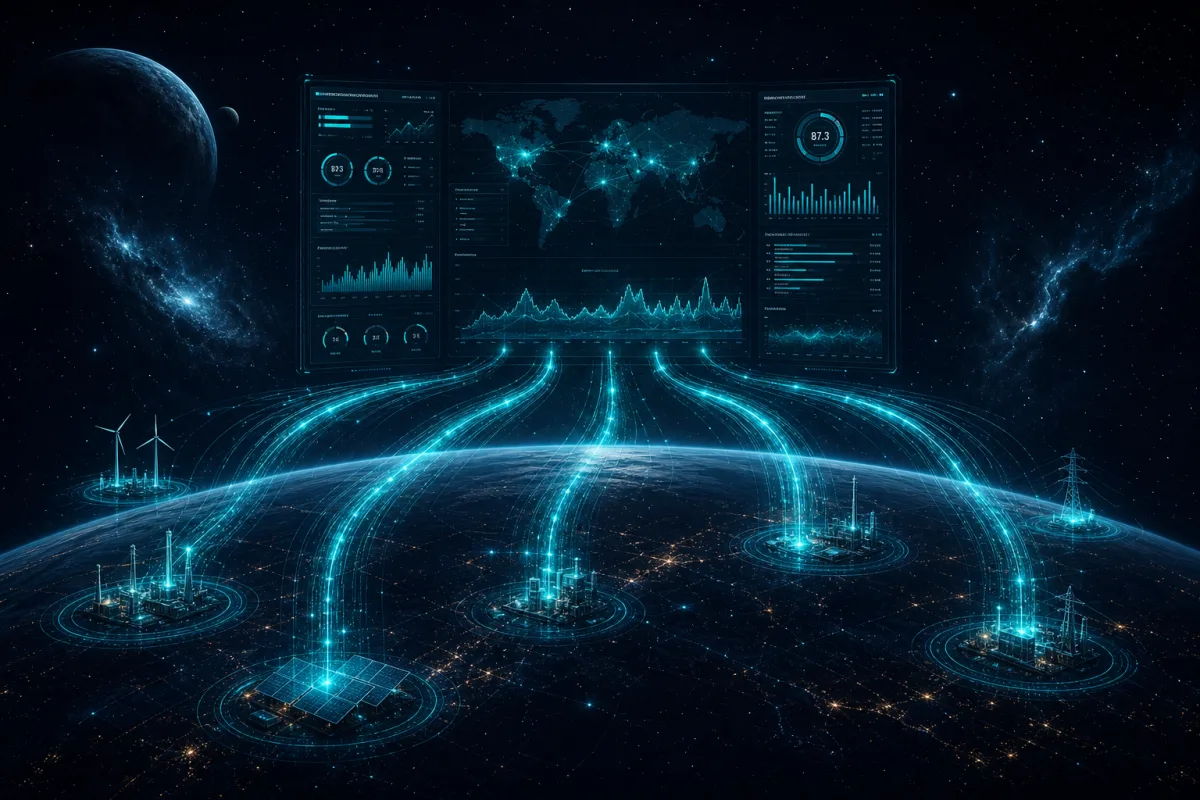
Energy field operations generate more data than most teams know what to do with. Sensors on wellheads, flow meters on pipelines, pressure gauges across distribution networks — the data exists. What doesn't always exist is software that turns it into something operators can act on in real time.
Custom software for energy field operators builds that layer: ingestion infrastructure that handles sensor data at scale, processing pipelines that detect meaningful events, and operational dashboards that surface the right information at the right time.
What Field Operators Actually Need
We start every field operations engagement with the same question: what decision are you trying to make faster? Not "what data do you have," but "what would you do differently if you saw it in real time?"
The answers cluster around:
Anomaly detection. Pressure outside normal range. Flow rate deviation. Equipment vibration above threshold. Operators need to know when something is wrong before it becomes an incident, not after.
Production tracking. Real-time production rates vs. target. Cumulative daily production. Variance from forecast. The data for this exists; the dashboard often doesn't.
Maintenance signals. Equipment operating time, cycle counts, temperature trends. Predictive maintenance requires a data foundation — trending signals that precede failure events.
Regulatory compliance tracking. Emissions readings, flow volumes, pressure records. The data goes into compliance reports — it might as well be captured systematically rather than manually.
Architecture for Energy Field Data
Ingestion Layer
Field sensor data arrives through several mechanisms:
SCADA/DCS historians: Most mature field operations have a historian (OSIsoft PI, Honeywell PHD, others) that collects SCADA data. The integration path: OPC-UA or REST API from the historian into the cloud pipeline. For modern historians, this is well-defined. For older systems, sometimes a middleware layer or local edge aggregator is needed.
IoT sensors publishing directly: Newer deployments push MQTT or HTTP directly from sensors to cloud endpoints. AWS IoT Core handles device registration, authentication, and message routing.
Manual or batch imports: Some data is still captured manually or exported as CSV from local systems. We design ingestion pipelines that accept both real-time and batch inputs, normalizing them into the same data model.
# Lambda function: process MQTT message from AWS IoT Core
import json
import boto3
from datetime import datetime

dynamodb = boto3.resource("dynamodb")
timestream = boto3.client("timestream-write")

def handler(event, context):
    # Normalize incoming sensor payload
    sensor_id = event["sensorId"]
    timestamp = event.get("timestamp", datetime.utcnow().isoformat())
    readings = event["readings"]

    # Write to Timestream for time-series queries
    records = [
        {
            "Dimensions": [
                {"Name": "sensor_id", "Value": sensor_id},
                {"Name": "site_id", "Value": event["siteId"]}
            ],
            "MeasureName": key,
            "MeasureValue": str(value),
            "MeasureValueType": "DOUBLE",
            "Time": str(int(datetime.fromisoformat(timestamp).timestamp() * 1000)),
            "TimeUnit": "MILLISECONDS"
        }
        for key, value in readings.items()
    ]

    timestream.write_records(
        DatabaseName="field-operations",
        TableName="sensor-readings",
        Records=records
    )
AWS Timestream is our time-series database of choice for sensor data: purpose-built for high-volume time-series ingestion, automatic tiering of recent vs. historical data, and SQL query interface that's familiar to analysts.
Anomaly Detection
Event detection runs in the processing layer. Two approaches:
Rule-based alerts: Threshold violations — pressure above X PSI, flow rate below Y MCF/day, temperature above Z degrees. Simple, deterministic, easy to configure and explain to operators.
def evaluate_alerts(sensor_id: str, readings: dict, rules: list) -> list:
    triggered = []

    for rule in rules:
        value = readings.get(rule["field"])
        if value is None:
            continue

        if rule["condition"] == "above" and value > rule["threshold"]:
            triggered.append({
                "rule_id": rule["id"],
                "sensor_id": sensor_id,
                "field": rule["field"],
                "value": value,
                "threshold": rule["threshold"],
                "severity": rule["severity"]
            })
        elif rule["condition"] == "below" and value < rule["threshold"]:
            triggered.append({...})

    return triggered
Statistical anomaly detection: For signals where the "normal" range varies (seasonally, by operating mode), rule-based thresholds miss real anomalies and false-alarm on normal variation. We use rolling window statistics — flag readings beyond N standard deviations from the moving average — which adapts to normal operating conditions.
Alerts route through SNS to SMS, email, or PagerDuty integration. For mobile field teams, we integrate with Twilio for SMS alerts on critical events.
Dashboard Architecture
Real-time operational dashboards have specific requirements that standard BI tools don't handle well: sub-minute data refresh, geographic map views, and multi-site aggregation.
For most field operations dashboards, we use:
Frontend: React with Recharts or Apache ECharts for time-series visualization. MapLibre GL or Leaflet for geographic views with sensor locations and status overlays.
Backend: API Gateway + Lambda serving Timestream queries. WebSocket connection (API Gateway WebSocket) for live data push.
Caching: AppSync or DynamoDB caching layer for stable reference data (site metadata, equipment inventory). Timestream for live sensor data.
// Real-time dashboard data subscription
const { data } = useSubscription(SENSOR_READINGS_SUBSCRIPTION, {
  variables: { siteId, sensorIds },
  onData: ({ data: { sensorReading } }) => {
    updateSensorState(sensorReading.sensorId, sensorReading.readings);
    checkAlertThresholds(sensorReading);
  }
});

// Time-series chart with auto-refresh
function SensorChart({ sensorId, metric, range }: Props) {
  const { data, loading } = useQuery(SENSOR_HISTORY, {
    variables: { sensorId, metric, startTime: range.start, endTime: range.end },
    pollInterval: 30000  // Refresh every 30 seconds
  });

  return (
    <ResponsiveContainer>
      <LineChart data={data?.sensorHistory}>
        <XAxis dataKey="timestamp" />
        <YAxis domain={['auto', 'auto']} />
        <Line dataKey="value" dot={false} strokeWidth={2} />
        <ReferenceLine y={ALERT_THRESHOLD} stroke="#D70000" strokeDasharray="3 3" />
      </LineChart>
    </ResponsiveContainer>
  );
}
For similar real-time data infrastructure, see our data analytics capability and the architecture overview in Real-Time Data Dashboard Development.
Integration with Existing Field Systems
Most field operations environments have existing SCADA, ERP, or maintenance management systems. The custom software layer integrates with — not replaces — these systems:
Historian integration: Read sensor data from the historian via API. The historian stays as the control system's source of truth; we build the operational visibility and analytics layer on top.
ERP integration: Push production data to the accounting/ERP system via API or scheduled export. Automate the data entry that previously required manual transcription.
Work order systems: Trigger maintenance work orders when anomaly detection fires. Integration with Maximo, SAP PM, or simpler work management tools via API.
Frequently Asked Questions
Can you work with our existing SCADA system without replacing it?
Yes. We build the analytics and visibility layer on top of existing SCADA infrastructure. The SCADA system remains the control system and primary data source; we pull data from it (via historian API, OPC-UA, or direct database access) and build the operational dashboard and analytics on top. No control system changes required.
How do you handle connectivity limitations in remote field locations?
Many field locations have intermittent connectivity. We design for this with edge buffering — IoT devices queue readings locally when connectivity is unavailable and sync when connection is restored. AWS IoT Greengrass supports local processing with cloud sync for environments with unreliable internet.
What sensors and protocols can you integrate with?
We've worked with Modbus, MQTT, OPC-UA, HTTP REST, and various manufacturer-specific protocols. Most modern sensors support at least one of these. For legacy systems with proprietary protocols, local edge hardware (Raspberry Pi, industrial PC) can act as a protocol converter.
How long does a field operations dashboard project take?
A focused single-site deployment with a defined sensor set and clear dashboard requirements: 8–12 weeks from kick-off to production. Multi-site deployments with historian integration and complex alerting run longer — typically 16–24 weeks.
Do we own the code and infrastructure after the engagement?
Yes. All code (frontend, backend, IaC) and infrastructure is delivered to your team. We can provide ongoing maintenance or train your team to operate independently — your choice.
Discuss your automation project → rutagon.com/contact | 907-841-8407 | contact@rutagon.com